TileFlow: Data Center CFD Modeling Software
Validation Studies
NCEP Data Center in Bethesda, Maryland
This data center is the subject of the publication Thermal Profile of a High-Density Data Center--Methodology to Thermally Characterize a Data Center (presented at 2004 ASHRAE Meeting in Nashville, TN; Publication NA-04-4-2) by Dr. Roger Schmidt of IBM. Dr. Schmidt have reported details of the data center and measurements of airflow rates through perforated tiles and cutouts, heat loads in the racks, and rack inlet temperatures.
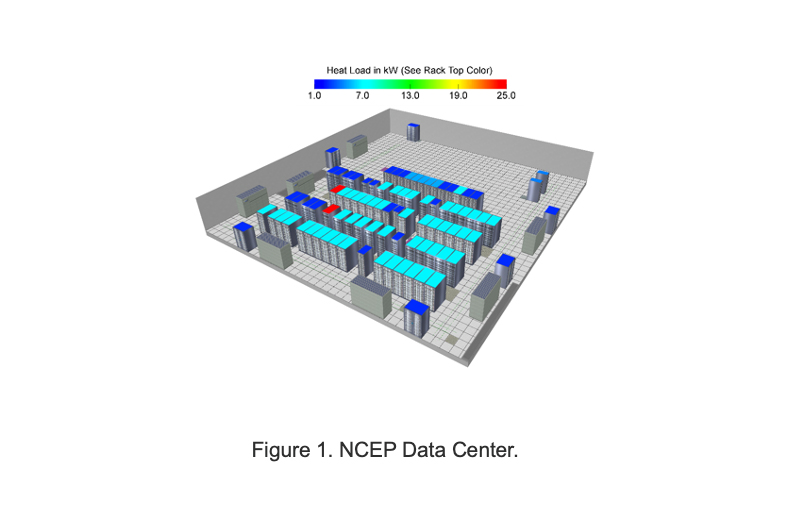
The floor plan of the data center is shown in Figure 1. The floor size is 74 ft x 84 ft, the ceiling height is 10 ft, and the raised-floor height is 17 in. The open area of the perforated tiles is 25%.
TileFlow was used to calculate the airflow patterns and temperature distribution in this data center. The calculated airflow rates through perforated tiles and rack inlet temperatures were compared with the measurements in the above-referenced publication. Representative results from this study are included here.
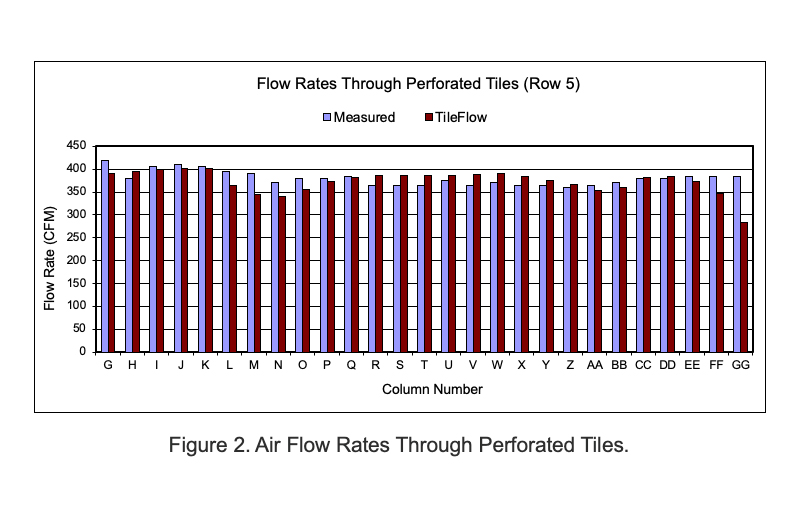
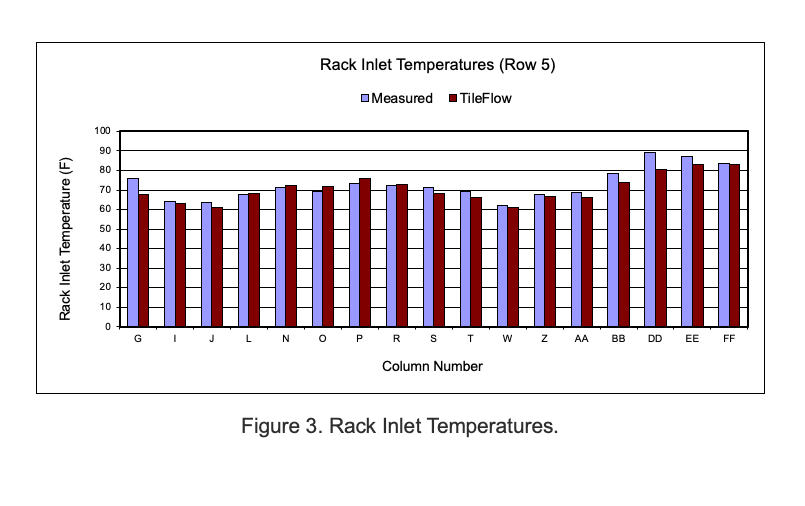
Figure 2 shows the comparison of measured and calculated airflow rates through the perforated tiles in one cold aisle. Figure 3 shows the comparison of measured and calculated rack inlet temperatures at elevation of 5.5 ft. These comparisons show that the results produced by TileFlow are highly accurate.